
In 2018 I produced a data logger as a component for a new piece of equipment for a chemical company, the brief was;
- Log historical data and allow retrieval for backup and review.
- Search data sets.
- View data by table or chart layout.
- Export data for other reasons (Excel or archival etc.)
- Control user access to data.
- Redundant operation in the event of failure.
- Keep data on the premises.
# Design
Of course I had to create all of the web UI, but the design phase really encompasses all the other decisions to be made. From choosing RS232 to the equipment, log format through to storage and delivery to the client in csv or chart forms.
Persisting data had an odd set of requirements:
- no master/replica relation could work since both nodes could act as a master
- You can't elect a master as with 2 nodes there's never a quorum to vote a new master, there should never be data conflicts.
- If that occurs it would be a corrupted record on the wire for both devices to discard. As opposed to conflicting data.
In this iteration I chose not to solve the failover multi-master problem. It wasn't in the original brief and instead chose to have a complete independent copy in each node.
I decided to use Redis to model data storage in could fit nicely with its api, I don't need GB's of data for decades. 10 years of log text is a few hundred MB (especially compressed), and the heavy use of a memory DB wouldn't unduly impact the embedded storage in the node. Finally should it become a problem I could add another layer to persist data beyond Redis in the background.
As for the graph layout, using D3 let me create something custom since the target user would be a person familiar with the equipment I'd crank the information density right up:
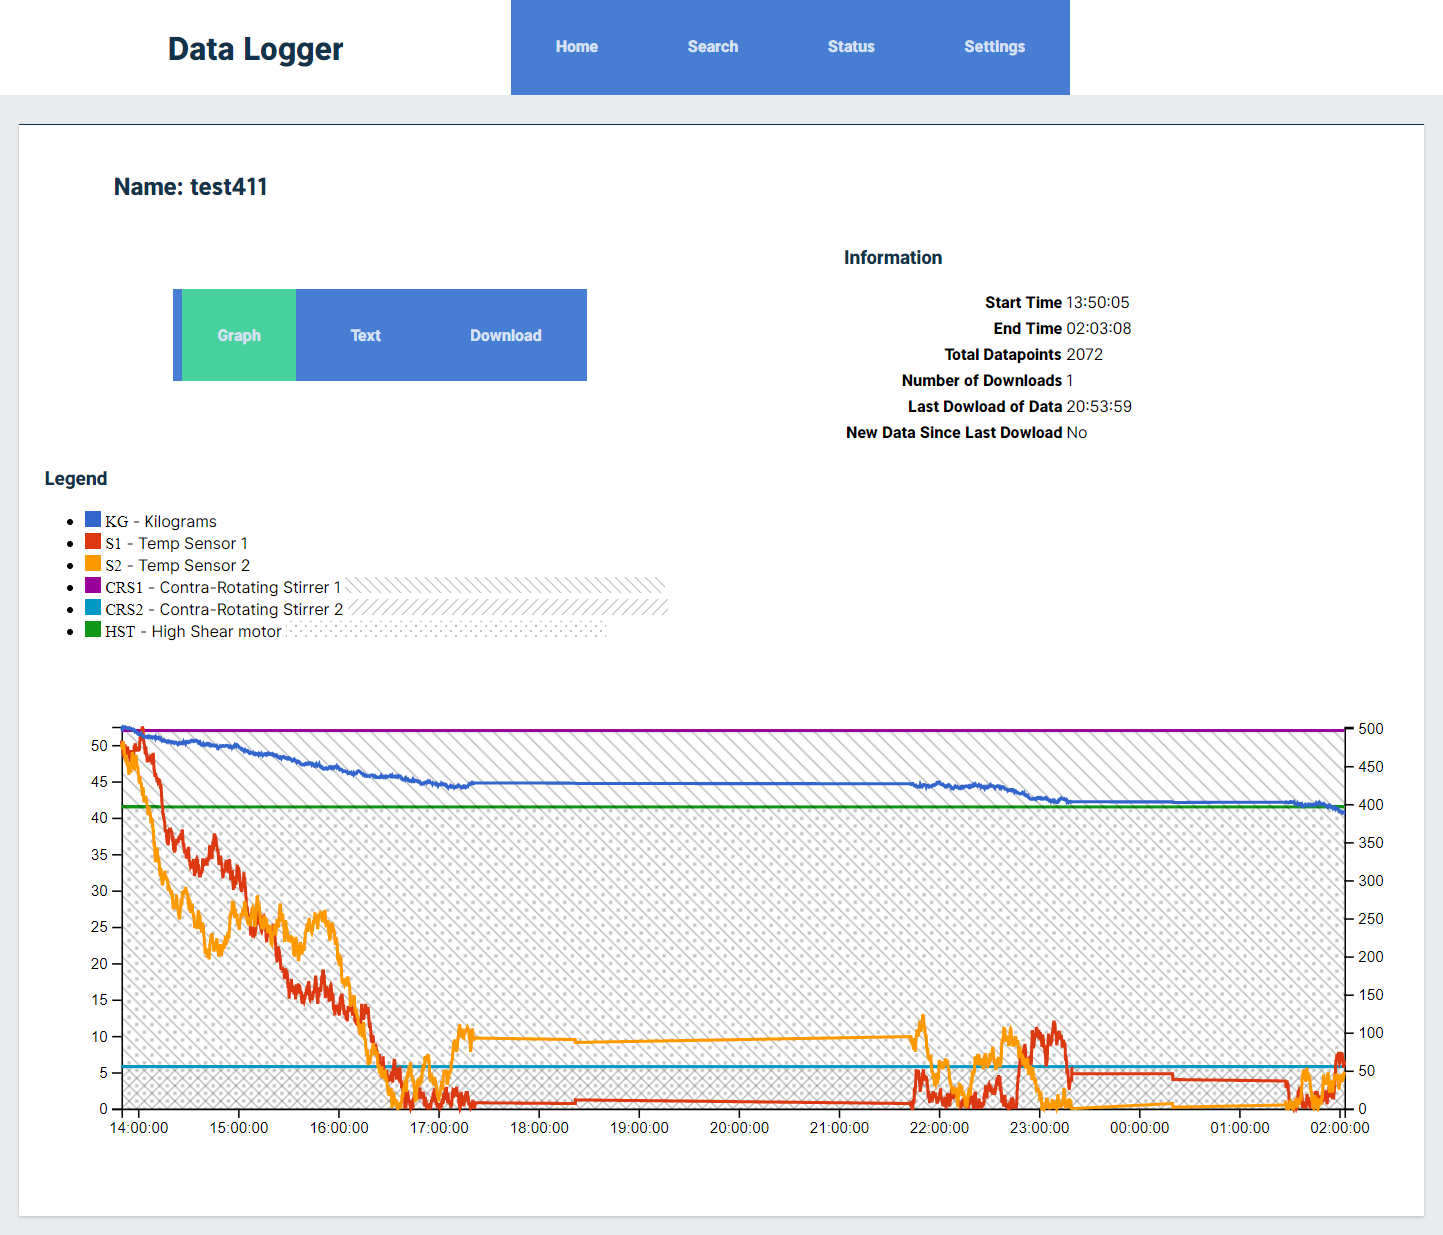
Note: This is randomly generate data weighted to trend over time
There's 3 axis, 6 data sets and 3 data series on here. Left axis being the temperature scale (2 series for that), the right axis is just the weight and of course the bottom axis is time. The 3 straight lines with shaded areas underneath represent the on/off state of certain motors. Each motor has a differing pattern (dot, forward or backslash) which do not cover each other up as they overlay.
Now, should you be this clever on every chart? NO! But if there's user training involved then go nuts.
# Develop
My language of choice for the project was node.js, coupled with the excellent SerialPort and Johnny Five libraries for hardware. The battle tested HAPI framework was used to make a REST API for connecting the containers as the web application. The business logic wasn't too hard to nail down, what took time was taking care of user management and health checking features. The graph uses D3 to create the SVG but that is manipulated by Vue.js rather than d3.select.
# External Factors
Every "run" by the equipment is identified by an ID sent from a machine. I have no control over this ID but it is the key by which users would want to look up the log data. I knew users would export data, There is no limit to when data may be added to a records ID since it's controlled by the machine. I can't make any current or future assumptions on its behaviour (i.e. never re-using an ID). My solution as to add an export timestamp to the record meant it's possible for a user to query any records with new data after being exported.
# Application
The glue that holds this all together would be Nginx routing traffic and Docker for isolating the parts of the app to make this possible to work on.
# Operations
By using docker containers to simplify what had to be moved to the host nodes, this also meant the code exactly matched what ran in development. I couldn't forget a file change or package or OS change that can get lots using only git. My own Arm device had to be the final build step before running on the hosts due to native modules being compiled for the hardware interface. I could build, tag and push containers to Gitlabs registry, the loggers will pull specified container versions to update the software as required. I was actually expecting this to be more difficult than it ended up being. Checking terraform and container hashes I'd know instantly if any logger node had drifted configuration.
# Hardware
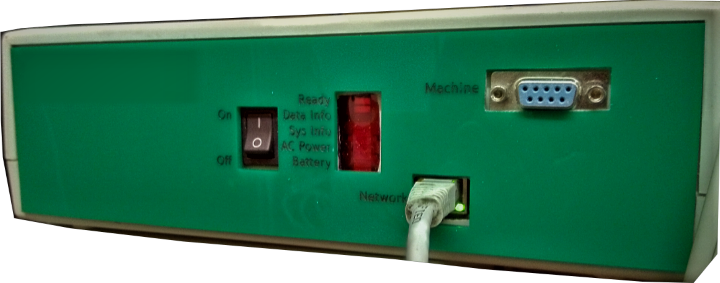
The SVG front panel were made in Inkscape and I laser cut them with an 80w CO2 laser out of acrylic. Unfortunately the picture of this isn't great.
I controlled the LED indicators via node.js to show signs of life on the units. I documented a few sequences of flashing by the LEDs to indicate a subset of problems that might prevent users accessing the web server. The rest of the issues had a much easier to read status page.
Inside each case is a Raspberry PI, RS232 adapter, battery and power supply that can instantly switch between mains or battery. GPIO is also connected to relays from the supply which the hardware node.js also reacts to, alerting the front panel and starting OS timers and safe shutdown commands.
# Network
It was a concern to have anything on-site open to the internet. A wireguard interface from the loggers that connects to my own DNS endpoint. Terraform provisions this server, creates wireguard adapters with keys as well as set my DNS A record to this server. I can tear the VPN down again when not in use to close off any remote access.
# Areas to improve
Automating the build pipeline with gitlab-runner on any Raspberry PI to push new builds, coupled with docker compose pulling down new images to upgrade would be the first next step.
An Earlier iteration of this did use redundant nodes in failover, however it transpired when an issue took a node offline, it wasn't reported until the final node failed. For this reason nodes were operated independently of each other and management of device health was made more visible in the UI. Reincorporating multi-master failover and self recovery would be an achievable next step using something like TimescaleDB.
Personally I would like to learn to program the hardware interface in Rust as a way to guarantee the behaviour expected from on-site code.
Actual voltage monitoring to report battery health would be useful.
# Sharing
I'd love to place the code for this online and plan to use it to log some sensors around the house. I'm working on redeploying with kubernetes into a k3s cluster as a learning experience and will share my home version once it runs, if not finished. So check back or send me a message if you'd be interested further.